Warning: Creating default object from empty value in /afs/ir.stanford.edu/group/mappingtexts/cgi-bin/wordpress/wp-content/themes/folder2/core/library/class.layout.php on line 163

Warning: Creating default object from empty value in /afs/ir.stanford.edu/group/mappingtexts/cgi-bin/wordpress/wp-content/themes/folder2/core/library/class.layout.php on line 166

Warning: Creating default object from empty value in /afs/ir.stanford.edu/group/mappingtexts/cgi-bin/wordpress/wp-content/themes/folder2/core/library/class.layout.php on line 169

Warning: Creating default object from empty value in /afs/ir.stanford.edu/group/mappingtexts/cgi-bin/wordpress/wp-content/themes/folder2/core/library/class.layout.php on line 172

Warning: Creating default object from empty value in /afs/ir.stanford.edu/group/mappingtexts/cgi-bin/wordpress/wp-content/themes/folder2/core/library/class.layout.php on line 175

Warning: Creating default object from empty value in /afs/ir.stanford.edu/group/mappingtexts/cgi-bin/wordpress/wp-content/themes/folder2/core/library/class.layout.php on line 177

Warning: Creating default object from empty value in /afs/ir.stanford.edu/group/mappingtexts/cgi-bin/wordpress/wp-content/themes/folder2/core/library/class.layout.php on line 179

Warning: Creating default object from empty value in /afs/ir.stanford.edu/group/mappingtexts/cgi-bin/wordpress/wp-content/themes/folder2/core/library/class.layout.php on line 201

Warning: Creating default object from empty value in /afs/ir.stanford.edu/group/mappingtexts/cgi-bin/wordpress/wp-content/themes/folder2/core/library/class.layout.php on line 205

Warning: Creating default object from empty value in /afs/ir.stanford.edu/group/mappingtexts/cgi-bin/wordpress/wp-content/themes/folder2/core/library/class.layout.php on line 223

Warning: Creating default object from empty value in /afs/ir.stanford.edu/group/mappingtexts/cgi-bin/wordpress/wp-content/themes/folder2/core/library/class.layout.php on line 224

Warning: Creating default object from empty value in /afs/ir.stanford.edu/group/mappingtexts/cgi-bin/wordpress/wp-content/themes/folder2/core/library/class.layout.php on line 226

Warning: Creating default object from empty value in /afs/ir.stanford.edu/group/mappingtexts/cgi-bin/wordpress/wp-content/themes/folder2/core/library/class.layout.php on line 320

Warning: Creating default object from empty value in /afs/ir.stanford.edu/group/mappingtexts/cgi-bin/wordpress/wp-content/themes/folder2/core/library/class.layout.php on line 320

Warning: Creating default object from empty value in /afs/ir.stanford.edu/group/mappingtexts/cgi-bin/wordpress/wp-content/themes/folder2/core/library/class.layout.php on line 320

Warning: Creating default object from empty value in /afs/ir.stanford.edu/group/mappingtexts/cgi-bin/wordpress/wp-content/themes/folder2/core/library/class.layout.php on line 320

Warning: Cannot modify header information - headers already sent by (output started at /afs/ir.stanford.edu/group/mappingtexts/cgi-bin/wordpress/wp-content/themes/folder2/core/library/class.layout.php:163) in /afs/ir.stanford.edu/group/mappingtexts/cgi-bin/wordpress/wp-includes/feed-rss2.php on line 8
Mapping Texts » Geoff McGhee http://mappingtexts.stanford.edu Mon, 30 Apr 2012 16:29:49 +0000 en hourly 1 http://wordpress.org/?v=3.0.3 Visualization: Assessing Language Patterns http://mappingtexts.stanford.edu/?p=231 http://mappingtexts.stanford.edu/?p=231#comments Thu, 29 Mar 2012 23:45:04 +0000 Geoff McGhee http://mappingtexts.stanford.edu/?p=231

This is the second visualization from the project, showing the results of several natural language processing analyses of the original texts. It plots the language patterns embedded in 232,567 pages of historical Texas newspapers, as they evolved over time and space. For any date range and location, you can browse the most common [...]]]>
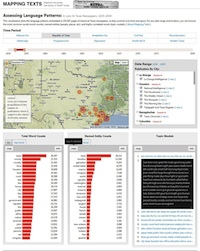
This is the second visualization from the project, showing the results of several natural language processing analyses of the original texts. It plots the language patterns embedded in 232,567 pages of historical Texas newspapers, as they evolved over time and space. For any date range and location, you can browse the most common words (word counts), named entities (people, places, etc), and highly correlated words (topic models).

See the visualization at language.mappingtexts.org »

]]> http://mappingtexts.stanford.edu/?feed=rss2&p=231 0
Paper: Topic Modeling on Historical Newspapers http://mappingtexts.stanford.edu/?p=193 http://mappingtexts.stanford.edu/?p=193#comments Tue, 27 Sep 2011 01:08:48 +0000 Geoff McGhee http://mappingtexts.stanford.edu/?p=193 As part of our ongoing research into text-mining historical newspapers, we’ve been experimenting with new methods for extracting language patterns scattered across millions of digitized words. One of the most intriguing methods for such work that has emerged in recent years is topic-modeling. The idea of topic modeling is, at base, to use mathematical and [...]]]> As part of our ongoing research into text-mining historical newspapers, we’ve been experimenting with new methods for extracting language patterns scattered across millions of digitized words. One of the most intriguing methods for such work that has emerged in recent years is topic-modeling. The idea of topic modeling is, at base, to use mathematical and statistical models to identify words that are related to one another and then group them into “topics.” The hope is to concept is to thereby expose underlying patterns in the language of large-scale collections that would be hard, if not impossible, to otherwise see.

And so we have been experimenting with topic modeling for this project, concentrating on the popular MALLET software package. We recently presented a paper based on this work at the meeting of the Association for Computational Linguistics in June 2011, “Topic Modeling on Historical Newspapers.”

Download the paper: Topic Modeling on Historical Newspapers

From Proceedings of the 5th ACL-HLT Workshop on Language Technology for Cultural Heritage, Social Sciences, and Humanities (2011), pp. 96-104.

]]>
http://mappingtexts.stanford.edu/?feed=rss2&p=193 0
Visualization: Digitization Quality http://mappingtexts.stanford.edu/?p=153 http://mappingtexts.stanford.edu/?p=153#comments Thu, 12 May 2011 18:41:17 +0000 Geoff McGhee http://mappingtexts.stanford.edu/?p=153

This visualization plots the quantity and quality of 232,567 pages of historical Texas newspapers, as they spread out over time and space. The graphs plot the overall quantity of information available by year and the quality of the corpus (by comparing the number of words we can recognize to the total number scanned). The [...]]]>

Click to go to the visualization

Click to go to the visualization

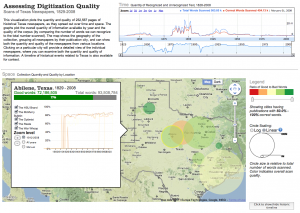
This visualization plots the quantity and quality of 232,567 pages of historical Texas newspapers, as they spread out over time and space. The graphs plot the overall quantity of information available by year and the quality of the corpus (by comparing the number of words we can recognize to the total number scanned). The map shows the geography of the collection, grouping all newspapers by their publication city, and can show both the quantity and quality of the newspapers from various locations. Clicking on a particular city will provide a detailed view of the individual newspapers, where you can examine both the quantity and quality of information. A timeline of historical events related to Texas is also available for context.

See the visualization »

]]> http://mappingtexts.stanford.edu/?feed=rss2&p=153 0